01 · Telecom · B2C · 4 min read
Leading the redesign of Oi’s self-service during lockdown
I led the redesign of Oi’s call interceptor at the peak of the pandemic, as calls to the call center surged. The new screen increased self-service retention by 11%.
- Problem
- During the pandemic, calls to the call center exploded and support couldn’t keep up.
- What I did
- As the lead, I gathered the numbers from other teams, aligned requirements with the PO, led the analysis and guided the designer through to the final layout.
- Result
- +78% clicks to pay a bill and +11% self-service retention.
My role
- Me, as the lead: I gathered the numbers from other teams, aligned requirements with the PO, analyzed and synthesized the data, and guided the designer at every step.
- The team’s designer: created the wireframes and the final layout.
What the interceptor is
The interceptor is a screen that appears on the customer’s phone as soon as they call support. It offers a way to solve the problem digitally, without waiting on the line.
During lockdown, with physical stores closed and the call center at its limit, Marketing was pushing for the brand’s visual refresh (rebranding) and for new menu options. As the lead, my job was to make sure the new look didn’t get in the way of the screen’s goal: avoiding the call.
Three pressures at once
The interceptor had different versions, one for each support number (IVR) the customer dialed. Marketing wanted to roll out the company’s new visual identity. Product wanted more menu options, to expand self-service. And Operations needed, above all, fewer people reaching a human agent.
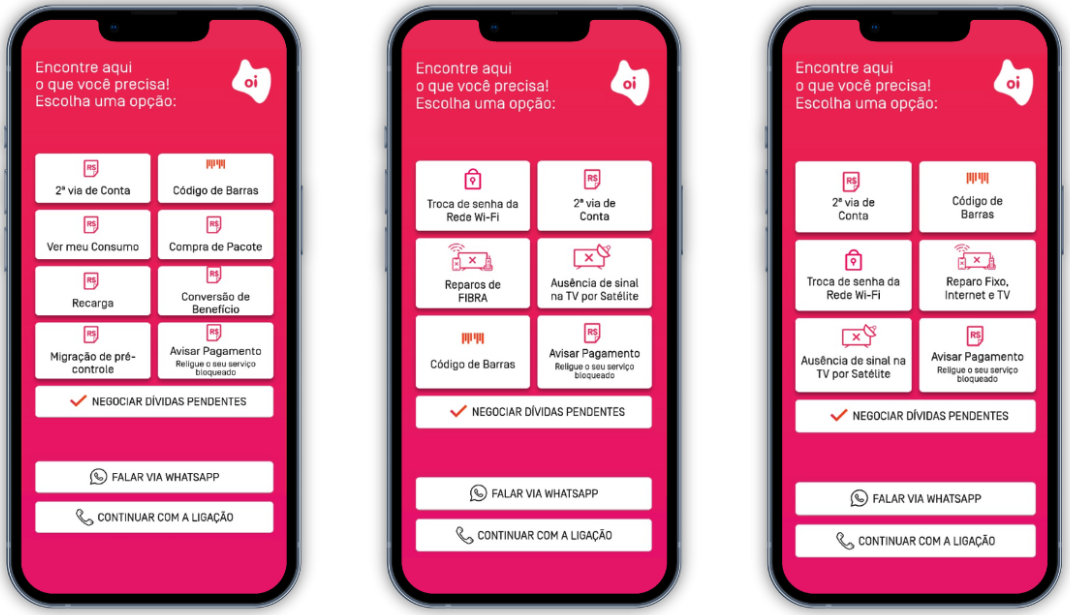
We used the rebranding to reorganize the menu. Instead of adding options, we proposed merging similar topics, so people had less to read before deciding.
We gave up some more specific buttons and changed key labels, like the WhatsApp one. We knew this could cause some doubt at first, but the goal was a screen where people could decide quickly.
The problem with the old screen
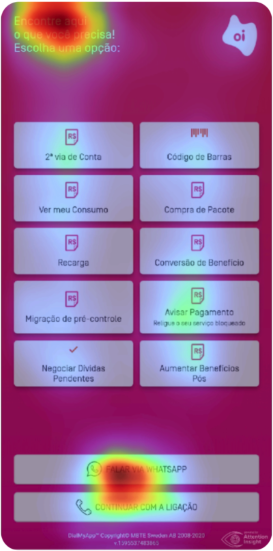
Analyzing the original screen, I found more than 10 options in two columns, with no visual hierarchy. According to Hick’s Law, the more options there are, the longer people take to decide.
And people calling in the middle of lockdown, already stressed, had to remember where each thing was instead of recognizing what they were looking for right away.
Two buttons for the same thing
I noticed that “Duplicate bill” and “Barcode” were separate paths that led to different places: one asked people to download the app, and the other opened a mobile site that had already been discontinued.
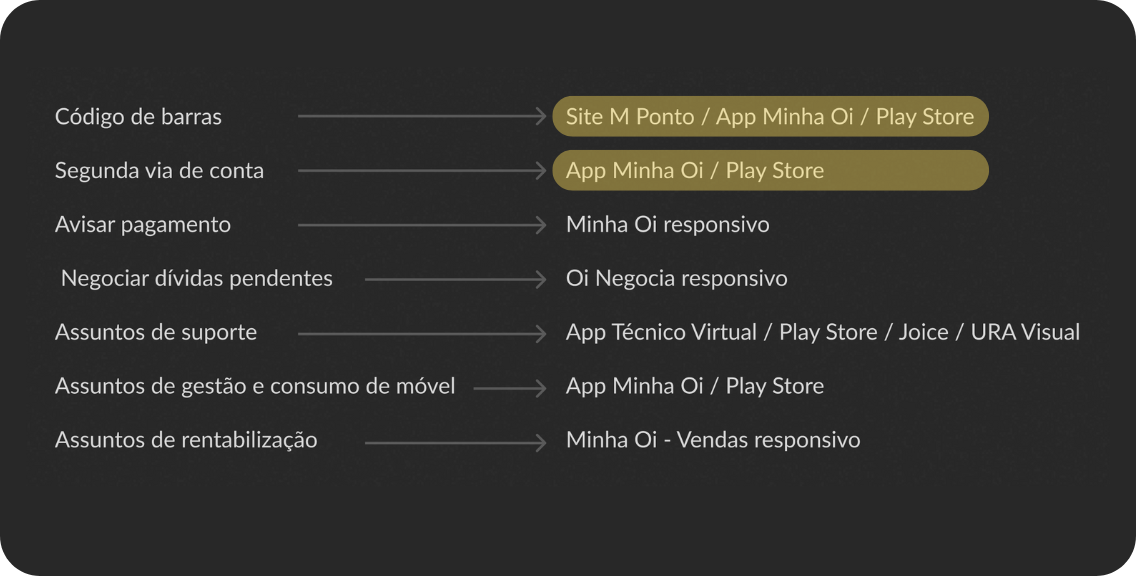
From the self-service website’s behavior data, I found that people looking for a “duplicate bill” really just wanted the barcode to pay it.
So we proposed a single button for both, leading to the responsive self-service website, which was more stable and didn’t require any download.
What the data showed
I gathered from other teams the reasons people called the call center and the clicks on the interceptor, from January to July 2020, and cross-checked them to decide what came first.
The WhatsApp button
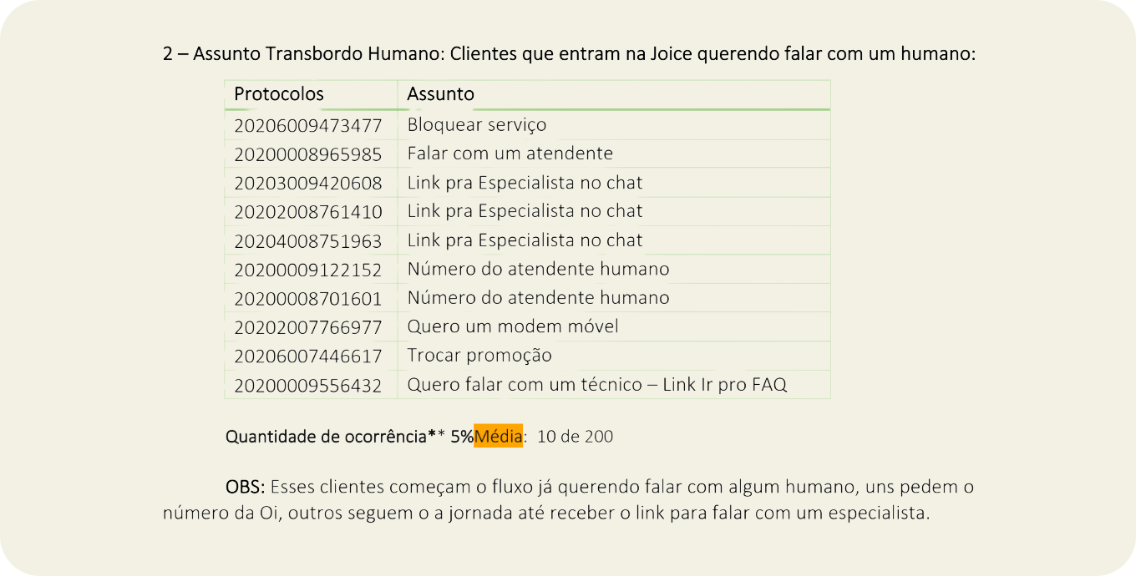
I found that the “Chat on WhatsApp” button got up to 42% of clicks in some profiles, like TV and Fiber. In other words, digital wasn’t solving the problem: people clicked WhatsApp to try to reach someone, not because they preferred that channel. But the button led to Joice, Oi’s virtual assistant, not to an agent. So we proposed changing the label to “Talk to Joice”, making it clear there was no human support there.
What came off the screen
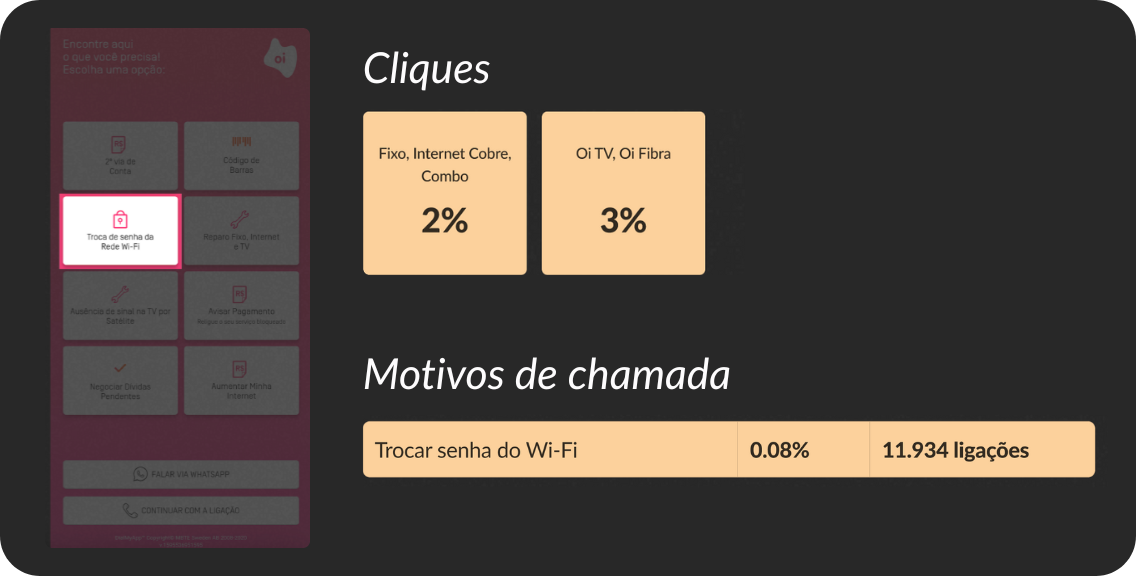
We proposed removing low-use options from the main screen, like “Change Wi-Fi password”: 2% to 3% of clicks, depending on the profile, and 0.08% of calls. That freed up space for the topics with the most volume.
Result
In 3 weeks, we delivered the new screen, already with the new visual identity.
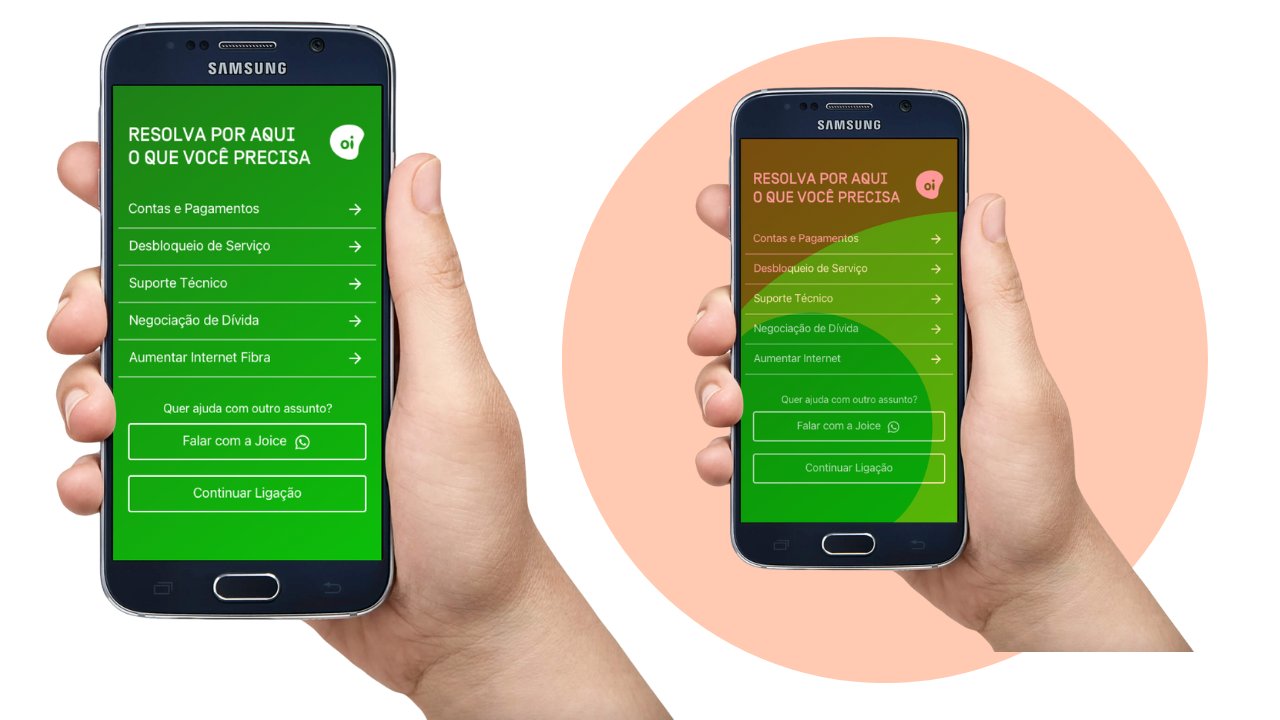
- net retention
- +11%
- clicks to pay
- +78%
- internal navigation
- +21%
The jump in clicks to pay relieved Oi’s finance team. About the 21% increase in internal navigation: merging topics may have made some options harder to find. As the lead, I accepted this trade-off so customers wouldn’t give up on digital and end up in the queue for a human agent.
Today, I would run a first-click test to see whether the new “Bills” group is easy to understand for every profile.
What I would measure today
In 2020, we measured success with business metrics, like retention and clicks. Given the urgency of the project, we couldn’t collect experience metrics. Today, I would add:
- Time to first decision: see whether the menu is clear by measuring the time between the interceptor screen appearing and the choice of an option.
- Return-to-menu rate: spot confusing labels or broken expectations by measuring how often people go back to the main screen after selecting an option.
- Self-service resolution rate: measure real effectiveness by tracking how many people start the journey on the interceptor and solve their problem without escalating to a human agent.