01 · Telecom · B2C · 4 min read
Retention at Oi: survival design and rebranding in lockdown
An 11% increase in mobile self-service retention under the threat of operational collapse. A redesign of the call interceptor at Oi, one of Brazil’s largest telecom companies, to contain the surge in call center demand at the peak of the pandemic.
- Problem
- During the pandemic, calls to the call center exploded and support couldn’t keep up.
- What I did
- I cross-checked call reasons with real clicks and trimmed the interceptor menu in 3 weeks.
- Result
- +78% clicks to pay a bill and +11% self-service retention.
What the interceptor is
The call interceptor is a fallback visual interface shown on the customer’s smartphone the moment they call support. Its goal is to intercept the intent to call and offer an immediate digital way to solve the issue (self-service).
During lockdown, with physical stores closed and the call center at its limit, Marketing was pushing for the brand’s visual refresh (rebranding) and for new menu options. My mission was to make sure aesthetics didn’t compromise how well the screen diverted calls.
Three pressures at once
The interceptor had different versions, triggered by the support number (IVR) the customer dialed. Marketing wanted to roll out the company’s new visual identity, and Product wanted to add more functions to the menu to widen the self-service options. All of this at the expense of the best experience and of the critical need to relieve the human channel (Operations).
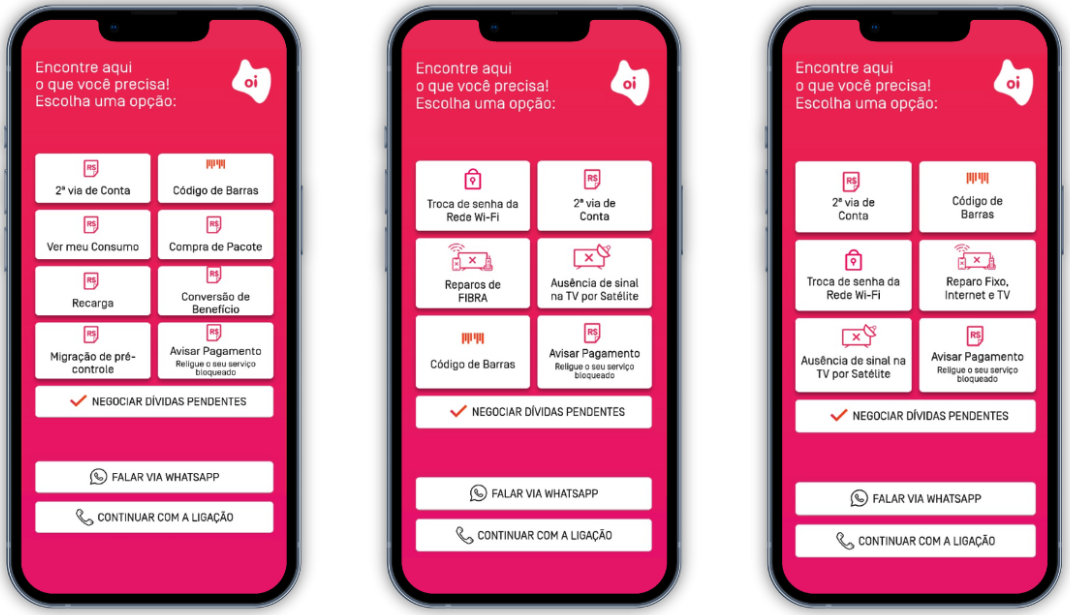
I used the rebranding as an opportunity to clean up the information architecture. I turned down the horizontal expansion of the menu and merged similar topics to reduce the effort of visual scanning.
I gave up the specificity of some buttons and changed critical labels (like WhatsApp), taking the risk of causing momentary doubt in exchange for an interface built for fast decisions.
Diagnosing the chaos: heuristics and laws of psychology
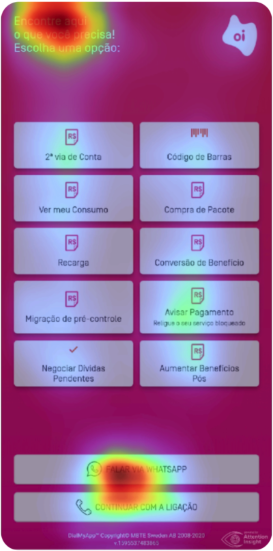
The original interface suffered from an overload of options that ignored Hick’s Law (decision time increases logarithmically with the number of choices).
With more than 10 options in two columns and no visual hierarchy, users under stress (lockdown) were forced into excessive memory effort, violating the recognition rather than recall heuristic.
Taxonomy and behavior audit
I noticed that “Duplicate bill” and “Barcode” were treated as separate paths and, worse, led to fragmented experiences. One required downloading the app and the other sent people to a mobile site (a discontinued environment), causing friction and frustration.
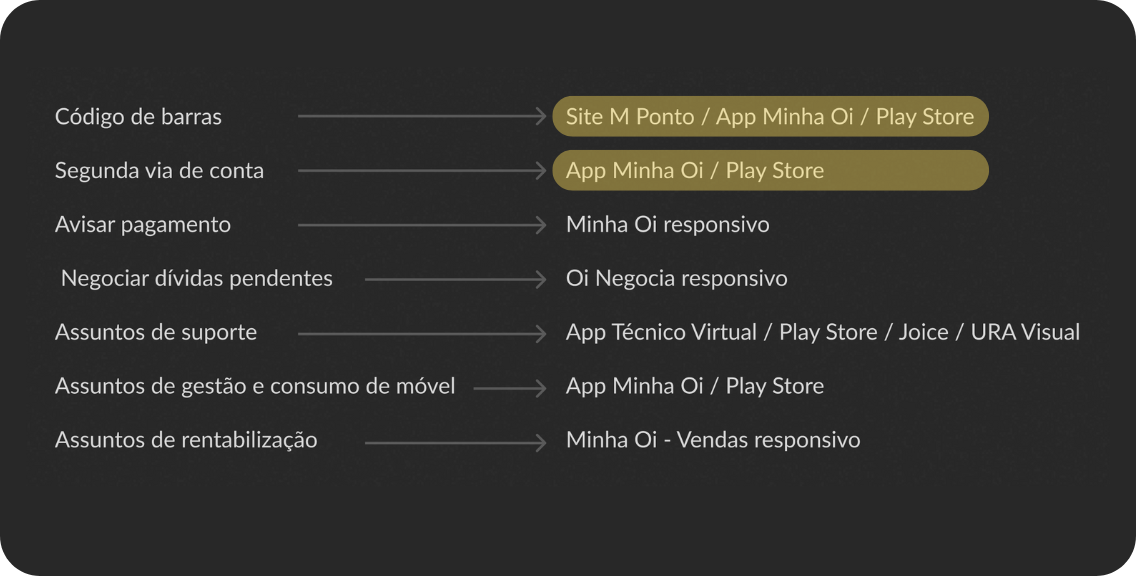
Based on behavior data from the self-service website, I found that when people looked for a “duplicate bill”, what they really needed was just the barcode to pay it.
I merged the two terms into a single strategic button, sending the flow to the responsive self-service website (more stable and with no download barrier). This removed the confusion of destinations and simplified the information architecture.
Data-driven design
I cross-checked the reasons people called the call center with the real clicks on the interceptor (data from January to July 2020) to define what was a priority.
The escape hatch
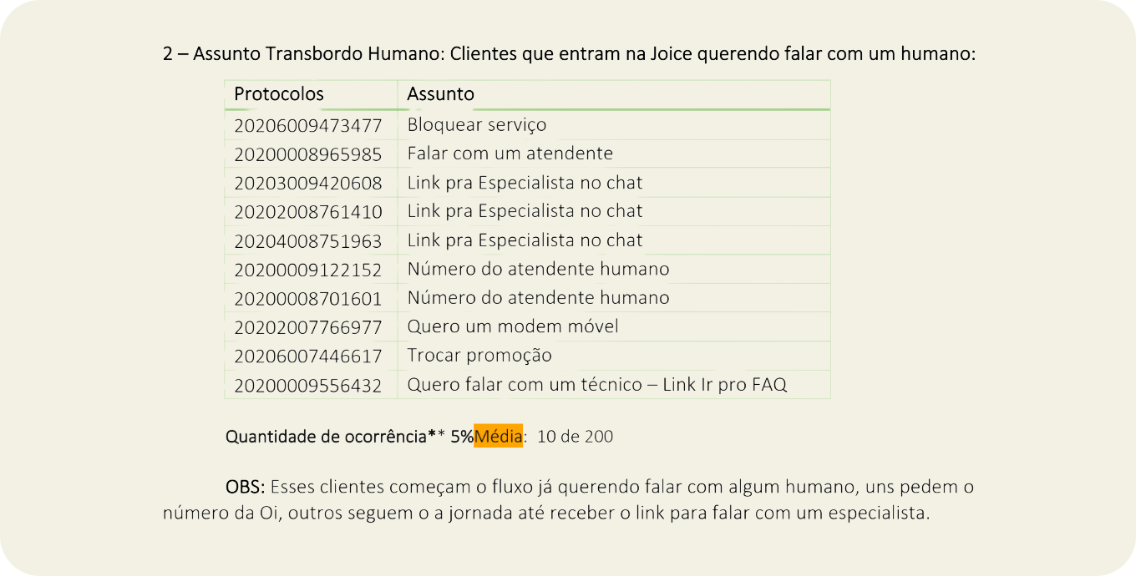
I found that the “Chat on WhatsApp” button held up to 42% of the clicks in some profiles (like TV and Fiber). This signaled that the digital channel was failing: people clicked WhatsApp as an “escape hatch” to try to reach a human, not because they preferred that channel. The decision was to change the label to “Talk to Joice” (Oi’s virtual assistant), to make it clearer that the button would not lead to a human agent.
Cutting what had little impact
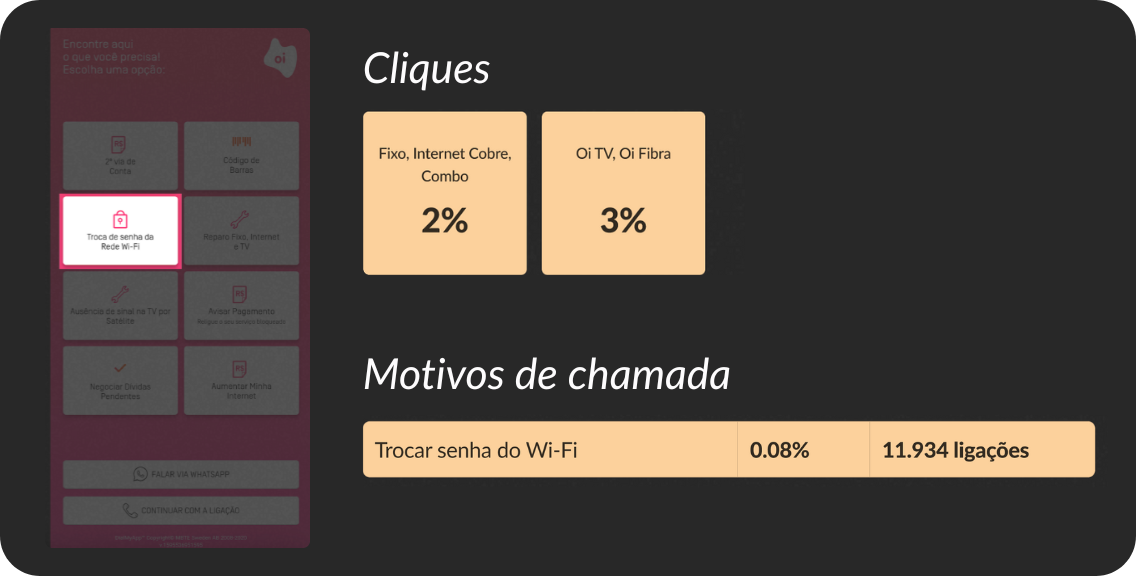
Options like “Change Wi-Fi password” (just 2% to 3% of clicks, and 0.08% of calls) were removed from the main screen to give prime space to high-volume flows.
Solution and results
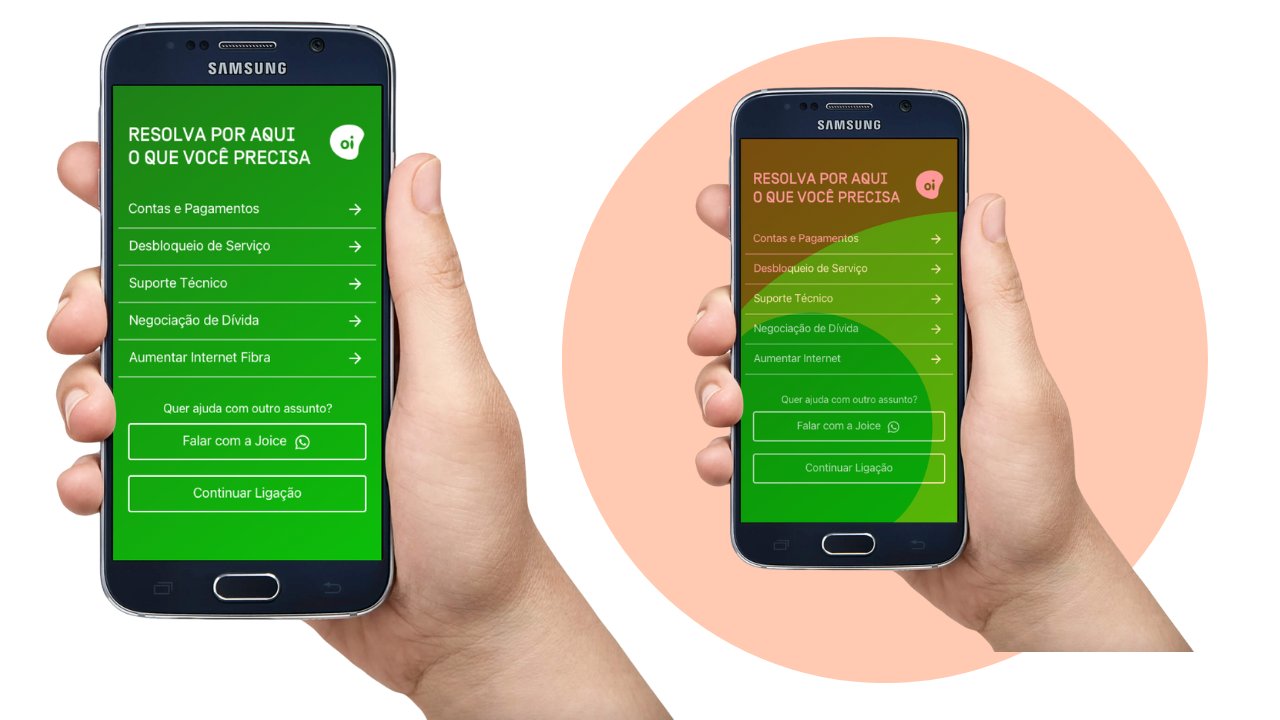
In just 3 weeks, we delivered the new layout integrated with the rebranding.
- net retention
- +11%
- clicks to pay
- +78%
- internal navigation
- +21%
The jump in clicks to pay relieved Oi’s finance team. About the 21% increase in internal navigation: as a senior designer, I recognize that merging topics may have increased search time, but it was an accepted trade-off to make sure customers didn’t give up on digital and end up in a queue for a human agent.
Today, I would run a first click test to validate whether the new semantic grouping under “Bills” is intuitive for every profile.
What I would measure today
In the context of 2020, success was measured mainly through business metrics, such as retention and clicks. To make sure the experience was sustainable and effective from the user’s point of view, I identified the need for specific UX metrics that couldn’t be collected at the time, given the urgency of the project:
- Time to first decision: assess the clarity of the menu and the cognitive load by measuring the time between the interceptor screen appearing and the choice of an option.
- Return-to-menu rate: spot confusing labels or broken expectations by measuring how often people go back to the main screen after selecting an option.
- Self-service resolution rate: measure real effectiveness by tracking how many people start the journey on the interceptor and solve their problem without escalating to a human agent.